Essential Links
ParlVu is an online service provided by the Canadian House of Commons that offers live and on-demand streaming of parliamentary proceedings. This platform allows Canadians to watch and listen to debates, committee meetings, and other events that take place in the House of Commons and its committees. ParlVu enhances transparency by giving the public direct access to the legislative process, enabling citizens to stay informed about the discussions and decisions that shape Canadian laws and policies. This is a major source for many of our videos that we produce.
OurCommons.ca is the official website of the House of Commons of Canada. It serves as a comprehensive resource for information about the House of Commons, including details on its members, proceedings, and legislative activities. Visitors to the site can access a wide range of content such as:
- Live and archived video streams of House debates and committee meetings
- Official records of parliamentary proceedings, including Hansard transcripts
- Information on bills and legislation under consideration
- Biographies and contact details for Members of Parliament
- News and updates on House activities and events
OurCommons.ca aims to promote transparency and civic engagement by providing Canadians with the tools and information they need to understand and participate in the legislative process.
The Office of the Commissioner of Lobbying of Canada website (lobbycanada.gc.ca) ensures transparent and ethical lobbying by administering the Lobbying Act and the Lobbyists’ Code of Conduct. The site features a searchable registry of lobbyist-reported information, resources for lobbyist education, compliance verification, and investigation reports. It aims to maintain fairness and impartiality in lobbying activities at the federal level. The site also provides guidelines on registration, reporting requirements, and rules for lobbying.
Elections Canada is the independent, non-partisan agency responsible for conducting federal elections and referendums in Canada. The website provides information for voters, including voter registration services, details on current and past elections, political financing, and tools for political entities. It also offers resources for media, employment opportunities, and information on foreign interference.
Statistics Canada (StatCan) is Canada’s national statistical agency, providing key information on the country’s economy, society, and environment. The website offers access to various data and analysis tools, covering topics such as population estimates, labor force surveys, trade data, GDP, and more. It includes resources for surveys, census information, and a range of statistical programs. Users can explore data hubs, download the StatsCAN app, and stay informed with the latest statistical news and updates
338Canada is a statistical model for electoral projections in Canada, created by Philippe J. Fournier. It analyzes opinion polls, electoral history, and demographic data to forecast election outcomes at federal and provincial levels. The site offers detailed projections for different regions, political parties, and upcoming elections, along with resources like a federal simulator and pollster ratings.
The Fraser Institute is an independent, non-partisan Canadian research and educational organization. It focuses on public policy issues such as government spending, taxation, education, and healthcare. The institute publishes research reports, conducts educational programs, and engages in public outreach to promote policies that it believes will improve the quality of life for Canadians through free-market principles. Northern Perspective values the information that we obtain from TFI as it is reliably non-partisan.
Graphs, Data and Maps
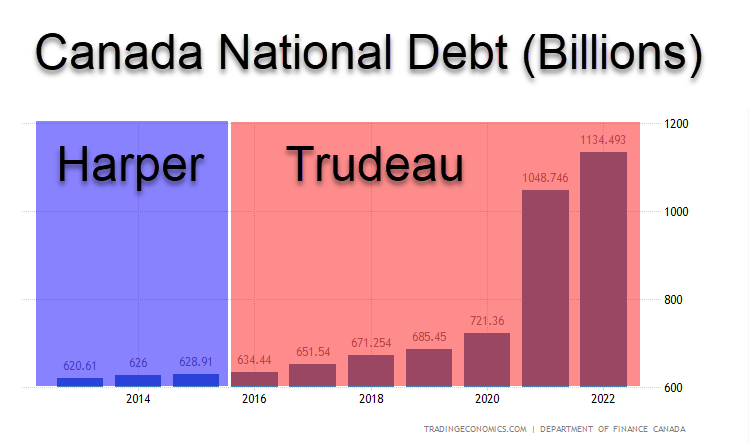
This graph illustrates the growth of Canada’s national debt in billions of dollars from 2014 to 2022, segmented by the terms of Prime Ministers Stephen Harper and Justin Trudeau. Under Harper (2014-2015), the debt increased slightly from $620.61 billion to $634.44 billion. Under Trudeau (2016-2022), the debt rose dramatically, from $651.54 billion in 2016 to $1,134.493 billion in 2022, with a notable increase starting in 2020, coinciding with the COVID-19 pandemic.
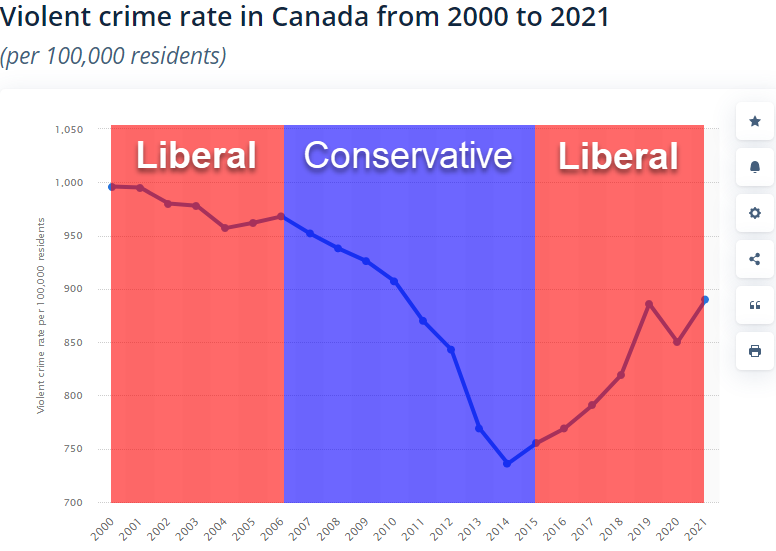
This graph displays the violent crime rate in Canada from 2000 to 2021, measured per 100,000 residents. The background colors indicate the political party in power:
- Liberal (2000-2005): The rate starts above 1,000, showing a slight decrease to around 950.
- Conservative (2006-2015): The rate continues to decline significantly, reaching its lowest point below 750.
- Liberal (2016-2021): The rate initially remains low but then increases sharply from around 2017, peaking again above 800 by 2021.
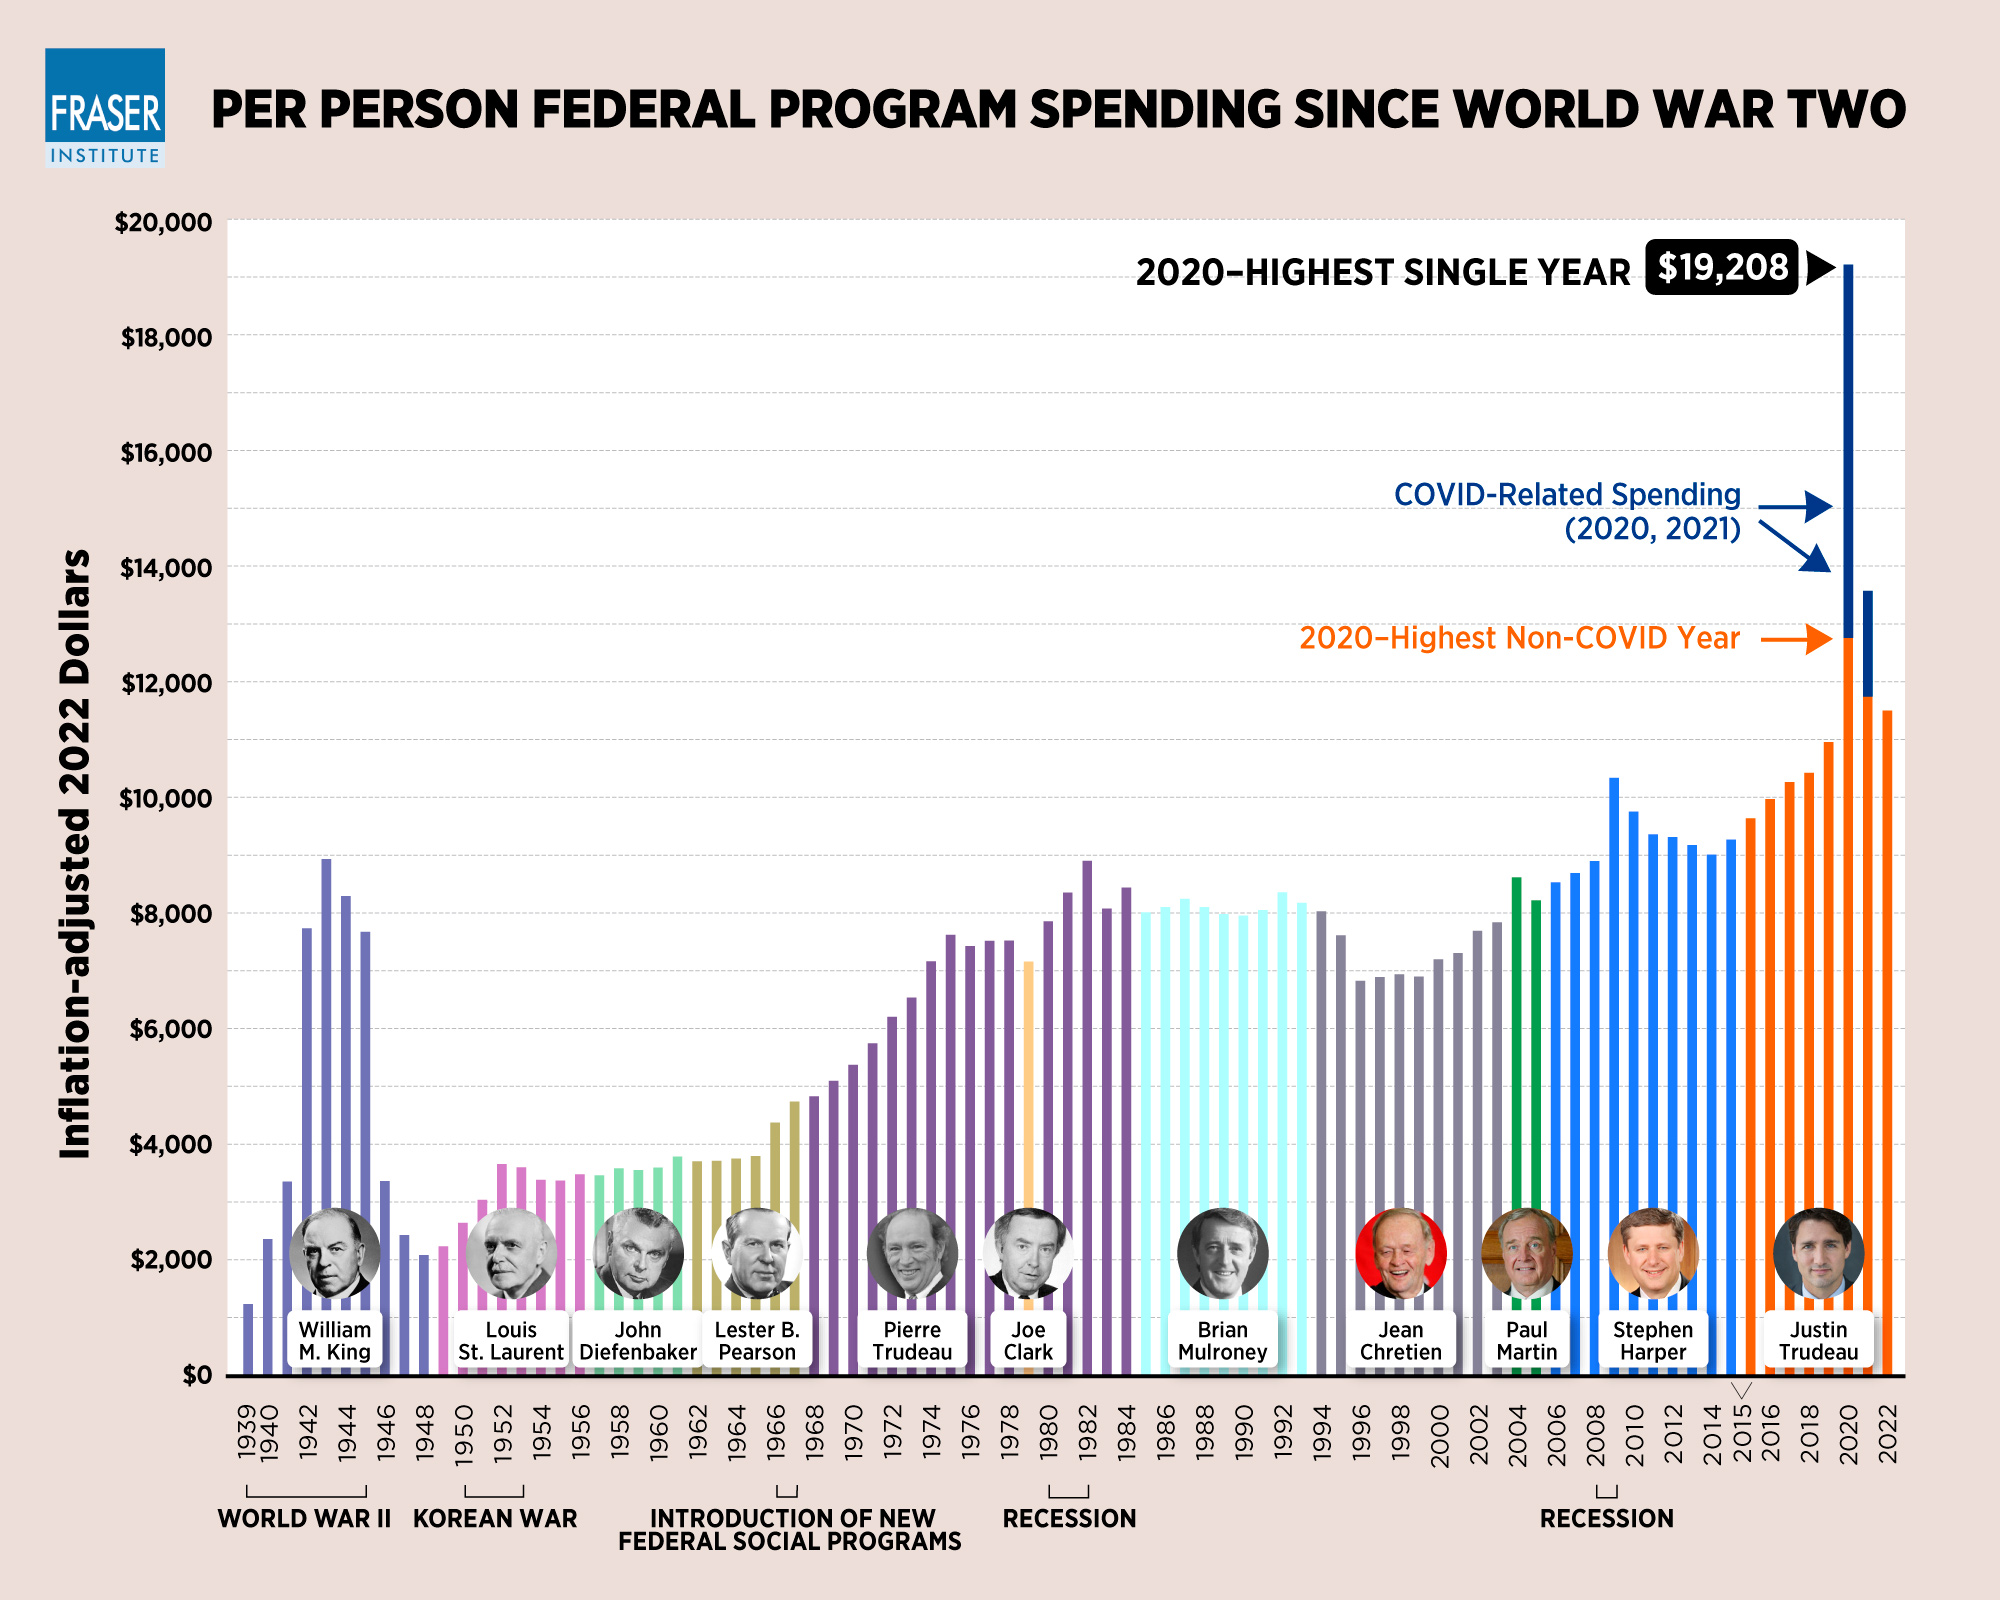
This graph from the Fraser Institute illustrates per person federal program spending in Canada, adjusted for inflation to 2022 dollars, from World War II to 2022. It highlights significant increases during various periods, especially under recent Prime Ministers:
- 2020: Highest spending year ($19,208 per person), largely due to COVID-related expenditures.
- Historical Trends: Peaks during World War II, the introduction of new federal social programs, and economic recessions.
- Prime Ministers: Spending patterns under different leaders, with notable increases under Justin Trudeau.
For a detailed view, refer to the Fraser Institute’s website.
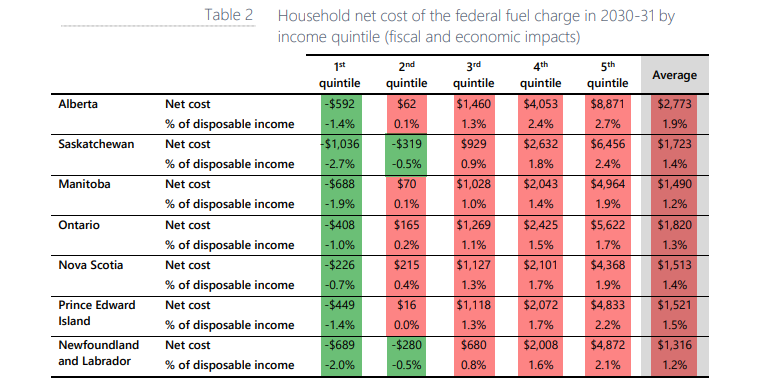
This table shows the household net cost of the federal Carbon Tax in 2030-31 by income quintile across various Canadian provinces. The net cost is measured in dollars and as a percentage of disposable income. Lower-income households (1st quintile) in most provinces experience a net benefit or minimal cost, while higher-income households (5th quintile) bear a significant cost. For example, in Alberta, the net cost for the 1st quintile is -$592 (a benefit), while for the 5th quintile, it is $8,871, reflecting 1.9% and 2.7% of disposable income, respectively. The average net cost varies by province.

This chart visualizes the percentage of total global carbon emissions in 2021 by country. Key contributors include:
- China: 30.9%
- United States: 13.5%
- India: 7.3%
- Russia: 4.7%
- Japan: 2.9%
- Germany: 1.8%
Other notable countries like Canada, Brazil, South Korea, and Indonesia each contribute between 1.1% and 1.7%. The “Rest of World” category accounts for 21.7% of emissions. The chart highlights the disproportionate contributions from a few large emitters.
